From Wednesday to Thursday, the number of pies decreased by 150.
From Thursday to Friday, the number of pies increased by 60.
So the correct graph must go down first, then go up by a smaller amount.
Only option 2 shows this.
2
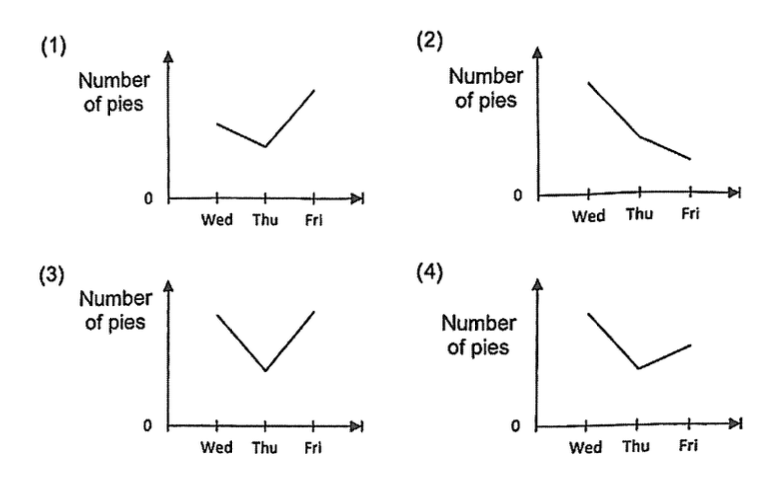
The number of pies sold at a bakery decreased by 150 from Wednesday to Thursday and increased by 60 from Thursday to Friday. Which graph shows the number of pies sold at the bakery from Wednesday to Friday? (1 mark)
Answer: 2
From Wednesday to Thursday, the number of pies decreased by 150.
From Thursday to Friday, the number of pies increased by 60.
So the correct graph must go down first, then go up by a smaller amount.
Only option 2 shows this.
2