Loading drawing…
Loading drawing…
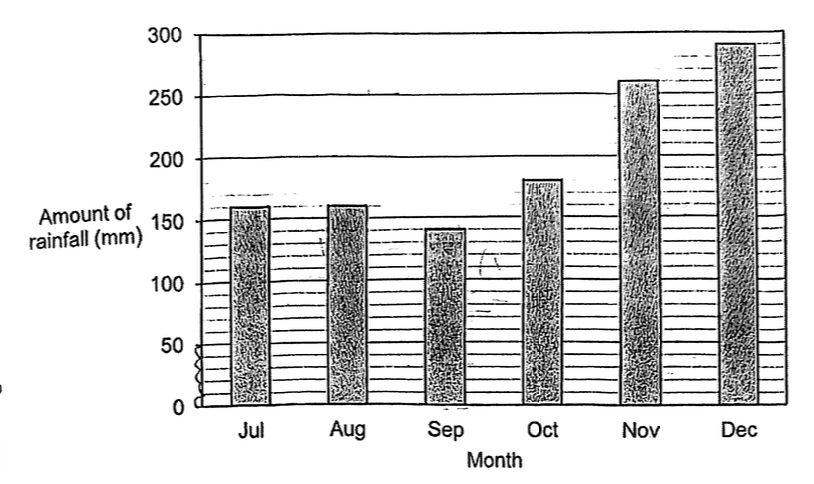
highest amount → tallest bar lowest amount → shortest bar
highest amount → Dec lowest amount → Sep
5 gaps → 50 1 gap → 50 ÷ 5 = 10
Sep → 140 Dec → 290
Difference → 290 - 140 = 150
The bar graph shows the amount of rainfall each month from Jul to Dec in 2024. What is the difference between the highest amount of rainfall in a month and the lowest amount of rainfall in a month? (2 marks)
Answer: 150
Loading drawing…
Loading drawing…
highest amount → tallest bar lowest amount → shortest bar
highest amount → Dec lowest amount → Sep
5 gaps → 50 1 gap → 50 ÷ 5 = 10
Sep → 140 Dec → 290
Difference → 290 - 140 = 150