Independently verified solution.
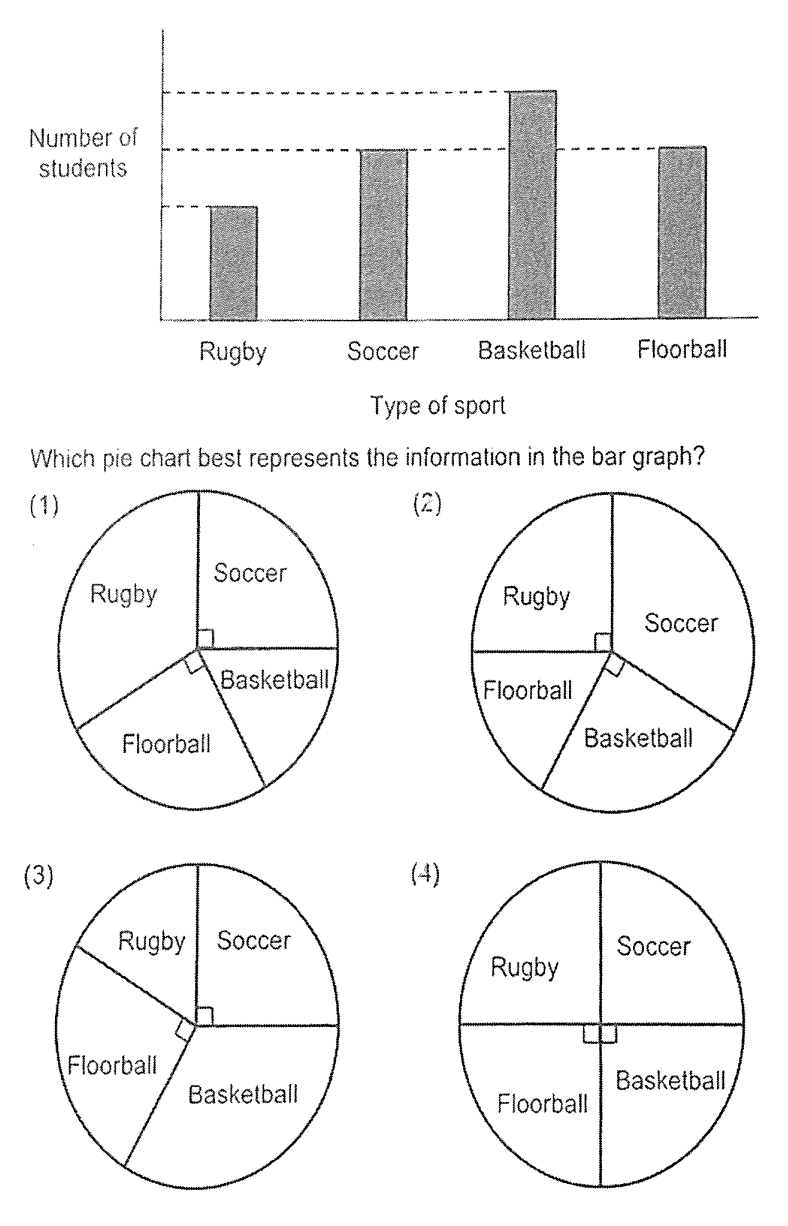
The bar graph shows Basketball as the largest group, Rugby as the smallest, and Soccer and Floorball equally large. The bars have relative heights 2 : 3 : 4 : 3, so Soccer and Floorball each occupy one quarter of the pie.
Pie chart (3) has the largest Basketball sector, the smallest Rugby sector, and equal quarter-circle Soccer and Floorball sectors. Chart (1) makes Rugby largest, chart (2) makes Soccer largest, and chart (4) makes all four equal.