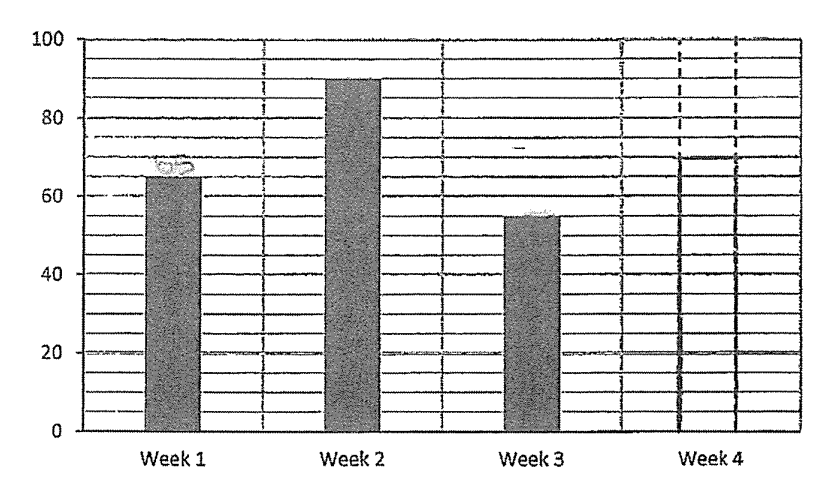
The graph scale has 4 gaps for 20 students, so each gap is 5.
Weeks 1 to 3 total 65 + 90 + 55 = 210 students. Week 4 = 1/3 × 210 = 70 students.
The bar graph shows the number of students visiting the school library over 4 weeks. The number of students in Week 4 is 1/3 of the total number of students from Week 1 to Week 3. Draw the bar representing the number of students for Week 4. You are not required to shade the bar. (1 mark)
The graph scale has 4 gaps for 20 students, so each gap is 5.
Weeks 1 to 3 total 65 + 90 + 55 = 210 students. Week 4 = 1/3 × 210 = 70 students.