June → 300 × (100 + 15)% = 345
Total from Feb to June = 150 + 250 + 230 + 300 + 345 = 1275 Average = 1275 ÷ 5 = 255
The line graph shows the monthly sales of fruits from January to May. There were 15% more fruits sold in June than in May. What was the average number of fruits sold per month from February to June? (2 marks)
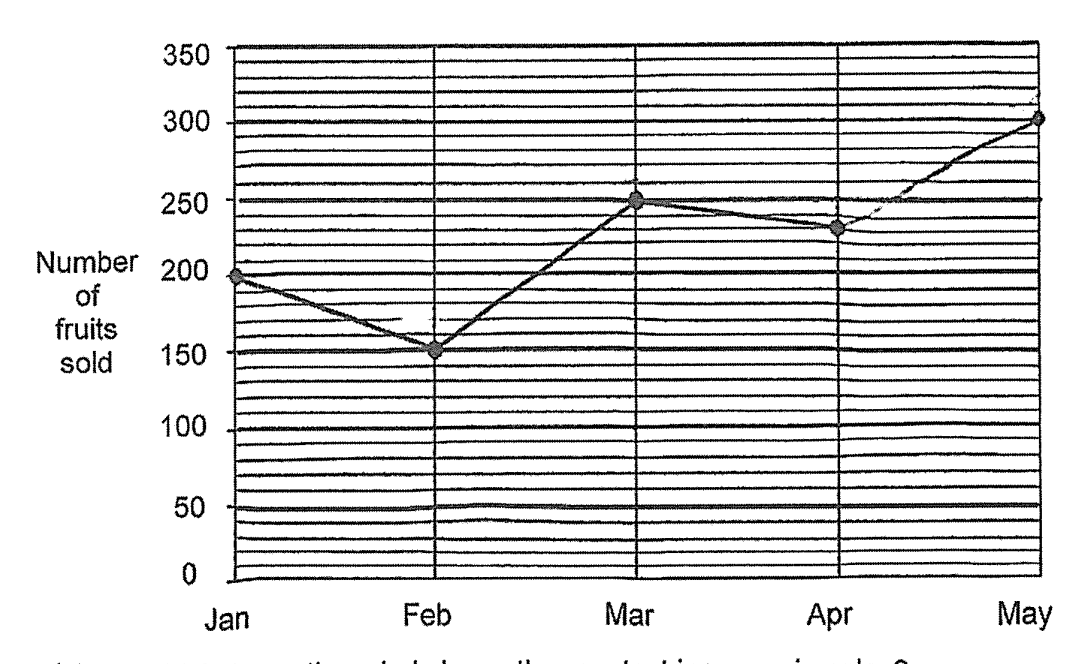
June → 300 × (100 + 15)% = 345
Total from Feb to June = 150 + 250 + 230 + 300 + 345 = 1275 Average = 1275 ÷ 5 = 255