← P6 Red Swastika 2025 Prelim Paper 2 · Paper 22025 / P6 Red Swastika 2025 Prelim Paper 2 · Paper 2 / Question 10b

Question 10b

Video explanation ↓

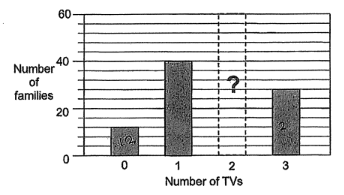
The bar graph shows the number of television sets some families have in their home. The number of families with 2 television sets is missing in the graph. 1/3 of the families have 2 television sets in their home. What is the average number of television sets each family have in their home? (2 marks)

Question 10b diagram

Answer: 1.7

Workings

Loading drawing…

5 gaps → 20 1 gap → 20 ÷ 5 = 4

1/3 of the families have 2 television sets in their home

remaining → 1 - 1/3 = 2/3

0 tv sets → 12 1 tv set → 40 3 tv set → 20 + 2 x 4 = 28

remaining → 12 + 40 + 28 = 80

2/3 families → 80 1/3 families (2 tv sets) → 80 ÷ 2 = 40

average number tv sets → total tv sets ÷ total families

total families → 80 + 40 = 120

total tv sets → 0 x 12 + 1 x 40 + 2 x 40 + 3 x 28 = 204

average number tv sets → total tv sets ÷ total families = 204 ÷ 120 = 1.7

Video explanations

1 video