Loading drawing…
Loading drawing…
5 gaps → 20 1 gap → 20 ÷ 5 = 4
cream → 48 cream → 3u
3u → 48 1u → 48 ÷ 3 = 16
4u (apple) → 4 x 16 = 64
There were 8 more custard pies sold than apple pies sold.
custard → 64 + 8 = 72
The bar graph below shows the types of pies sold in a bakery in a day. The ratio of the number of cream pies sold to the number of apple pies sold was 3 : 4. There were 8 more custard pies sold than apple pies sold. How many apple pies and custard pies were sold? Complete the bar graph. (2 marks)
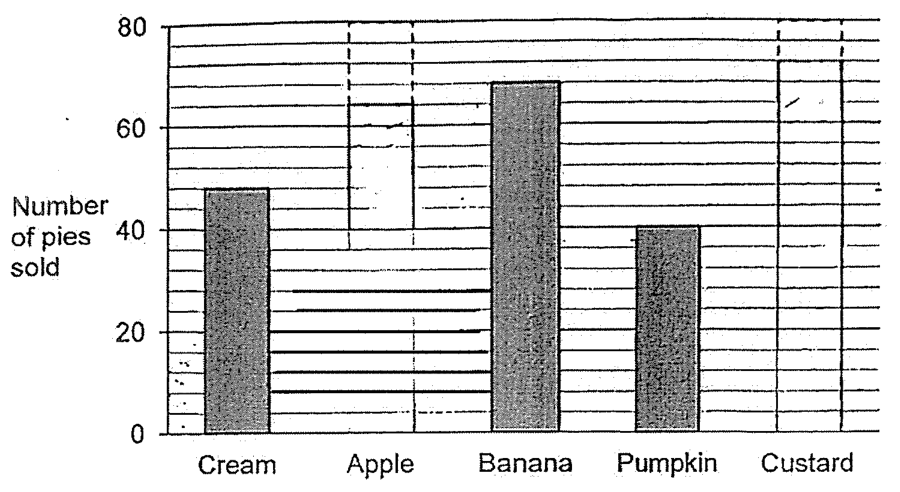
Answer: 64,72
Loading drawing…
Loading drawing…
5 gaps → 20 1 gap → 20 ÷ 5 = 4
cream → 48 cream → 3u
3u → 48 1u → 48 ÷ 3 = 16
4u (apple) → 4 x 16 = 64
There were 8 more custard pies sold than apple pies sold.
custard → 64 + 8 = 72