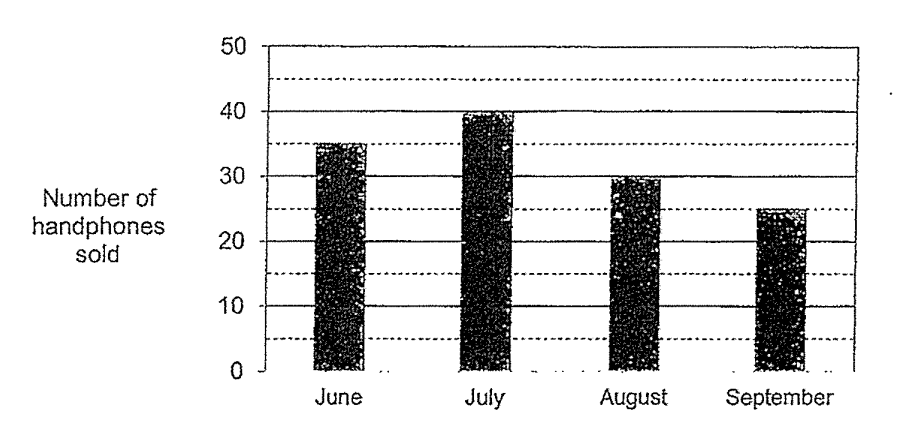
Two graph gaps represent 10, so one gap represents 5. The September bar represents 25 handphones.
Question 9
Video explanation ↓The graph shows the number of handphones sold by a shop from June to September. How many handphones did the shop sell in September? (1 mark)