Total number of burgers = 4 × 120 = 480 Total units = 10 + 20 + 8 + 22 = 60u
60u = 480 1u = 480 ÷ 60 = 8
April = 22u 22u = 22 × 8 = 20 × 8 + 2 × 8 = 160 + 16 = 176
The bar graph below shows the number of burgers sold at a restaurant from January to April. The number of burgers sold is not shown on the scale. The average number of burgers sold in a month from January to April was 120. How many burgers were sold in April? (2 marks)
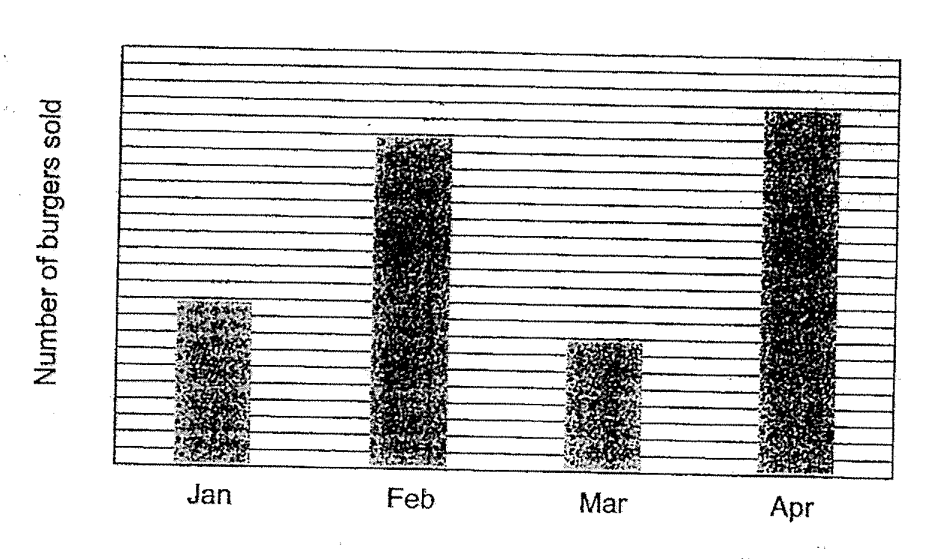
Total number of burgers = 4 × 120 = 480 Total units = 10 + 20 + 8 + 22 = 60u
60u = 480 1u = 480 ÷ 60 = 8
April = 22u 22u = 22 × 8 = 20 × 8 + 2 × 8 = 160 + 16 = 176