Loading drawing…
Loading drawing…
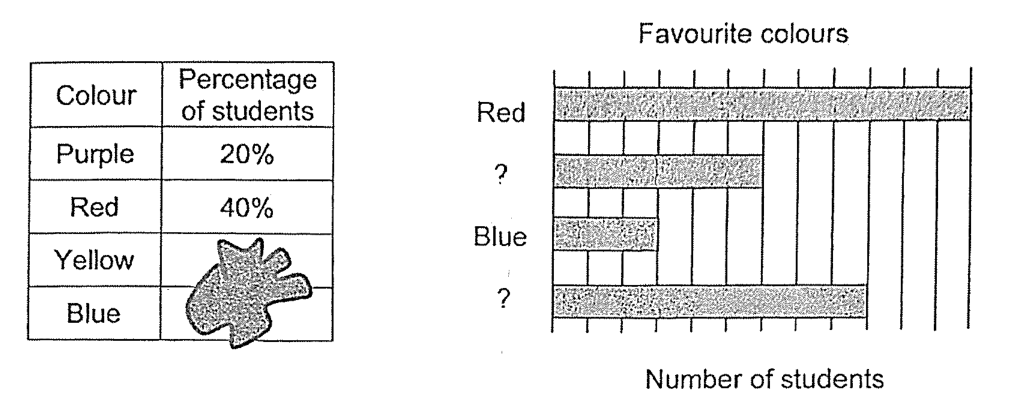
blue → 3u red → 12u 1st unknown → 6u 2nd unknown → 9u
red → 40%
40% (red) → 12u 20% (purple) → 6u
1st unknown is purple
6u → 20% 3u (Blue) → 20 ÷ 2 = 10%
yellow % → 100 - 20 - 40 - 10 = 30%
Some students chose their favourite colours in a survey. The table shows the responses. Part of the table was covered by an ink blot. The responses were also represented by a bar graph but some of the names of the colours were not indicated.What percentage of students chose yellow as their favourite colour? (2 marks)
Answer: 30 %
Loading drawing…
Loading drawing…
blue → 3u red → 12u 1st unknown → 6u 2nd unknown → 9u
red → 40%
40% (red) → 12u 20% (purple) → 6u
1st unknown is purple
6u → 20% 3u (Blue) → 20 ÷ 2 = 10%
yellow % → 100 - 20 - 40 - 10 = 30%