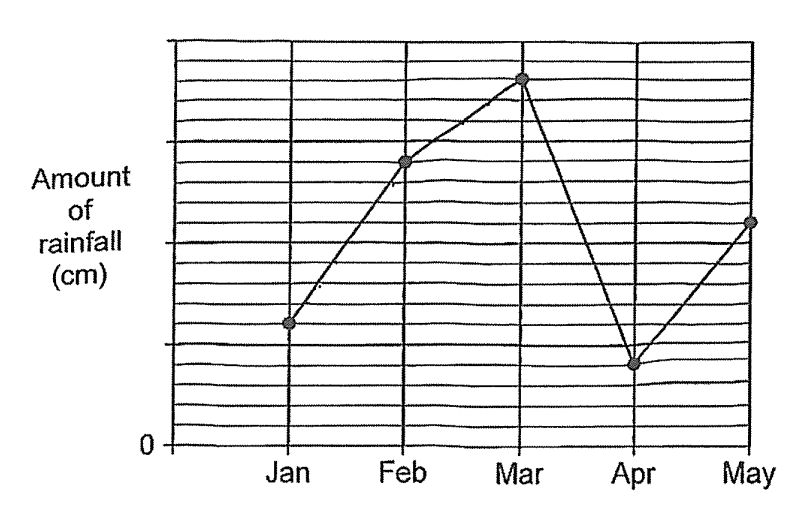
Assume 1 gap is 1. Jan = 6, Feb = 14, Mar = 18, Apr = 4, May = 11. Jan to Feb: +8. Feb to Mar: +4. Mar to Apr: −14. Apr to May: +7.
Question 8
Video explanation ↓The line graph shows the amount of rainfall over 5 months. The amount of rainfall is not shown on the scale. From which month to the next was the increase in rainfall the greatest? (1 mark)