Loading drawing…
Loading drawing…
5 gaps → 10 1 gap → 10 ÷ 5 = 2
january → 12 february → 30 march → 26 april → 18 may → 20
total → 12 + 30 + 26 + 18 + 20 = 106
The bar graph below shows the number of bicycles sold at a shop from January to June. How many bicycles were sold from January to May? (2 marks)
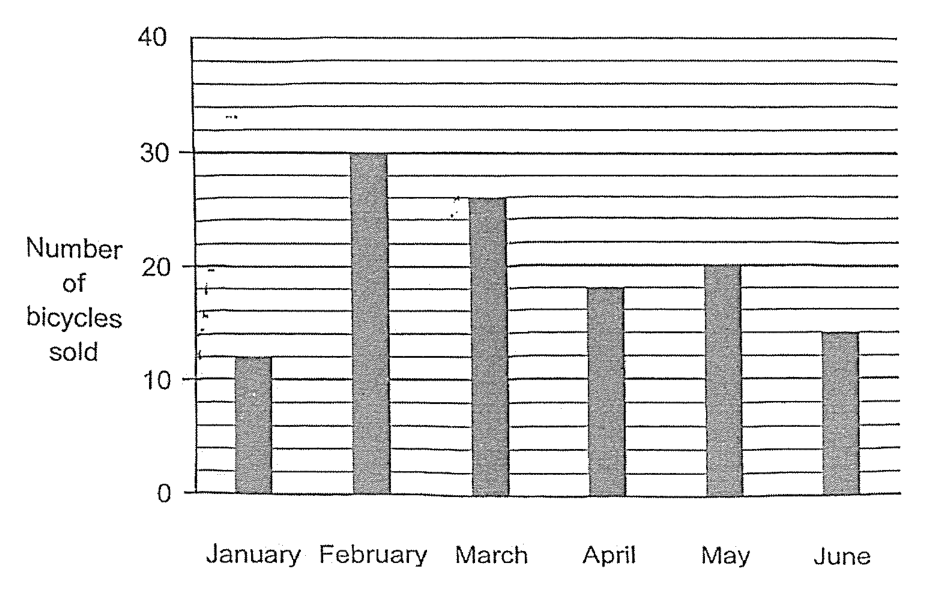
Answer: 106 bicycles
Loading drawing…
Loading drawing…
5 gaps → 10 1 gap → 10 ÷ 5 = 2
january → 12 february → 30 march → 26 april → 18 may → 20
total → 12 + 30 + 26 + 18 + 20 = 106
Loading drawing…
Loading drawing…
5 gaps → 10 1 gap → 10 ÷ 5 = 2
january → 12 february → 30 march → 26 april → 18 may → 20
total → 12 + 30 + 26 + 18 + 20 = 106